IntelliTrace and the ‘magic’ of Historical Debugging

I love my job, I get to spread the good news on how to work efficiently with source code and solve very real-life problems.
I recently visited a development team in Nevada that was eager to learn more about Visual Studio debugging tools and the C# compiler Open Source project in GitHub, named ‘Roslyn’.
The highlight of the sessions was the ‘discovery’ of IntelliTrace and how they could use this feature in improving the communication between the development team in Nevada and the QA team at another location. A few hard to reproduce bugs had been filed recently, one of them being intermittent without a consistent set of steps to reproduce. This team was using process dumps and WinDbg to try and pinpoint the cause, but, even though process dumps have their reason of being, the size of the dump files made the quest to search for a root cause quite difficult.

This is until they tried IntelliTrace in their QA environments.

IntelliTrace is similar to a flight recorder. It records every event the airplane goes through from take off to landing. IntelliTrace had its debut in Visual Studio 2010 Ultimate and is now here to stay.

Continue reading IntelliTrace and the ‘magic’ of Historical Debugging

Microsoft and Open Source

I love open source and have used open source technologies throughout my career. I programmed using the LAMP stack in the early 2000s, worked with Red Hat Linux before RHEL came about and contributed with unit tests and bug fixes to two open source frameworks: one logging framework and one ORM. So when my colleagues and friends knew I joined Microsoft, they were sure I wouldn’t be able to use open source software or publish any source code under an open source license.

Well… times have changed, like, really really changed! …and the Open Source Community is thriving, even at Microsoft. Talk Openly Develop Openly,  aka TODO, is an organization focusing on the challenges and opportunities of managing open source projects.

There is a Microsoft Code of Conduct that you should follow when you join one of Microsoft OSS communities. And yes, the code is for everyone to see. If you can understand it, there is no reason why that “truth” or source code should be hidden from you.

Do you want to contribute shaping the future of the .NET framework ecosystem and create open source solutions using this platform? Do you want to contribute to the a portion of the actual framework? You can, but you should abey by the rules of an open source community, which might not be as forgiving as a closed code one.

Happy coding!

C# Scripting available in the .NET Framework 4.6

I know I have a few friends and coworkers that prefer to have all the scripting done in their language of choice, C#. Before .NET 4.6+ their best bet for automating DevOps tasks in a Windows based infrastructure was, for the most part, PowerShell.

But, if you’re already familiar with the C# syntax and basic namespaces, why can’t you continue to use your favorite language to write scripts?

Well, now you can.

Thanks to the Roslyn compiler project, you can now use the nuget package to use the Scripting API.

The Scripting API, as of today, requires the .NET Framework Desktop 4.6 as a minimum, with the .NET Core this Scripting API should now be cross-platform. I haven’t tried it yet, but will do in a very near future and will blog about my experience using this Scripting API on CentOS.

Some directives that are present in PowerShell might not be present yet on the Scripting API (I’m thinking cd, ls etc), but it is worth the try.

You can also script away using C# in a browser, any browser… And we now have a new file extension for C# scripts => .csx files.

C# Scripting and csx file projects are highly used in creating Bot services hosted on Azure using the RESTful APIs provided by Azure.

Happy coding and I hope you enjoyed the good news of C# Scripting.

Code away!

IIS 6.0 does not serve aspx pages out of the box

I have used ASP.NET for quite some time. I have probably always been lucky that the infrastructure or deployment person always enabled aspx on IIS for me. I use a Windows XP with IIS 5 sometimes or Vista with IIS 7. They do serve aspx pages by default, on XP once the .NET framework is downloaded and installed, there is nothing else to tweak.

On Friday afternoon, I had to deploy to an IIS 6 box on windows 2003, to my surprise, it didn’t serve any of the aspx pages. Even a small Hello World project on an simple label. I missed the happy hour with my colleagues and went home completely puzzle. Why? ASP.NET was already available when Windows 2003 saw the light. To my surprise there was nothing on the event log.

The answer came a few hours later and after few Google queries:

IIS 6.0: ASP.NET Is Not Automatically Installed on Windows Server 2003

1. Open IIS Manager, expand the master server node (that is, the Servername node), and then select the Web service extensions node.
2. In the right pane of IIS Manager, right-click the extension that you want to enable. In this example, this is Active Server Pages.
3. Click to select the Allow check box.
Add a New Web Service Extension to IIS 6.0

To permit IIS to serve content that requires a specific ISAPI or CGI extension that is not already listed in the Web service extensions list, follow these steps:
1.Open IIS Manager, expand the master server node, and then select the Web service extensions node.
2.In the right pane of the IIS Manager, click Add a new Web service extension under Tasks.
3.In the Extension name box, type a friendly name for the extension that you want to add (for example, FrontPage Server Extensions).
4.In the Required files box, click Add, and then select the path and the name of the file that will handle requests for the specific extension. After you select the path and the file name, click OK.
5. If the extension must be enabled immediately, click to select the Set extension status to allowed check box.
6. Click OK to save your changes.

Hopefully Mono will run seamless  on Apache one of these days…

Identifying performance bottlenecks on a .NET windows app using Windows Debugging Tools and ANTS Profiler. Part I: NHibernate byte[] types

This is a curious case that led me to discover and use a very valuable tool ANTS Profiler and read a few good blogs about .NET debugging and CLR internals. Read on to bookmark with me.

Near to Christmas we received a complain one of the windows applications was performing too slow after a few hours of usage. Performance monitor counters indicated the performance problem lied on high CPU peaks sustained for a long period of time.

.Net memory counters were somewhat fine, no increase on allocated bytes or overall memory consumption, no high IO reads, no high network usage…apparently the application was just doing its stuff, but for a long time, and each time longer…

First thing that came to our mind was an infinite loop, however the curious part on this case is that the CPU peaks took longer the longer the end user worked on the application and began to be noticeable after a couple of hours, not quite the definition of an infinite loop.

If only had we had a better CPU, had the performance downgrade been noticeable after more hours. This is something we had to be thankful for, bad CPU, less time to reproduce the problem. This was one of the typical production only problems too :-p

Long sustained CPU peaks, how we dug down on the cause:

First we grabbed the free debugging tools (insert the obvious reasons here, budget, management approval, etc): CLRProfiler, winDGB, SOS and ADPlus.

Two great blog posts about how to start with these tools can be found here (Speaking Of Which) and here (Maoni’s blog).

MSDN Magazine also has two good articles (Bugslayer column and this CLR Inside Out column) on the subject of windows debugging tools and how to use them in VS 2005.

Back to our own experience on the matter, CLRProfiler hung the machine beyond response and despite being able to sketch the object graph in memory, it was hard to correlate the time of the high CPU peaks with the information obtained from CLRProfiler.

This was not due to a problem with the tool itself, hanging was due to poor iron power and our over-consuming application and the inability to detect the main CPU usage cause was due to the fact that CLR profiler is only meant to identify and isolate problems related with garbage collection, excessive long lived objects or huge collections.

At first we thought the high CPU could be related with garbage collection due to long lived objects, see this post on Tess’s blog If broken it is, fix it you should.

We collected memory dumps with ADPlus during the high CPU peaks as per this lab blog post and analyzed the memory dumps using WinDBG.

At the end we decided to have more control on when the dumps were taken and use WinDBG while attaching it to the process. I should also mentioned ADPlus ended up generating dumps with errors when the system was really stressed.

Instructions to take dump via WinDBG :
1. Run the application.
2. Open up WinDBG. Click on File ?> Attach To Process ?> Select the process ?> Click on OK.
3. WinDBG attaches to the process and waits on the command line. Press ‘g’ and hit enter. ‘g’ is for letting the
application run.
4. Now whenever you want to take a dump, Hit Ctrl+Break in WinDBG. Now, type : .dump /ma C:\Dump1.dmp
This will take a dump.
5. Press ‘g’ and hit enter for the process to resume.

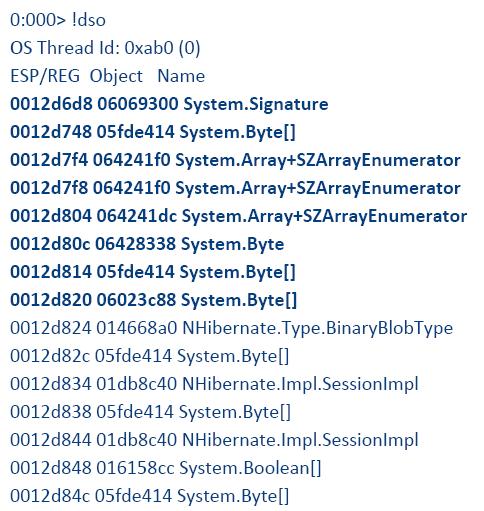
WinDBG can give valuable information about the CLR stack at the time the dump was collected (clrstack command), the types being scheduled for GC (!finalizequeue) and how many types marked for finalization belong to Gen 0, Gen 1 and Gen2.

Seeing your managed stack at a single point in time or having exact information about the memory allocation does not give information on the amount/% of CPU time each method takes though.

We tried taking dumps with WinDbg at the beginning of the CPU peak, in the middle and at the end but the results only offered a hint, too many Collections were allocated and lived to Gen 2. Some of this collections were byte arrays. It wasn’t apparent from analyzing the three managed stacks (from the three memory dumps) which method was consuming the longest time.

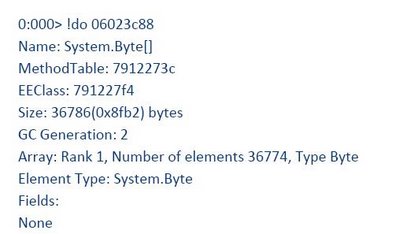
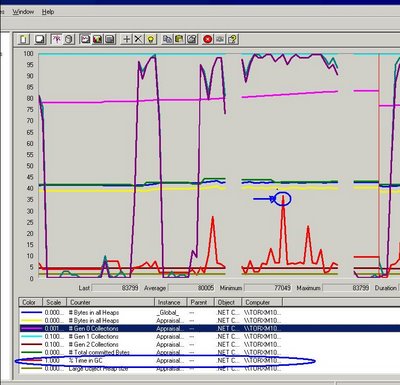
So far we had lots of collections surviving to Generation 2 and some of them were of type byte array. Garbage collection counters, however were within the “normal”.

If the application was just “busy” doing its stuff, where was this time spent? Data Binding? Event Brokerage? Database access latency and query performance had been already discarded with SQL Profiler btw.

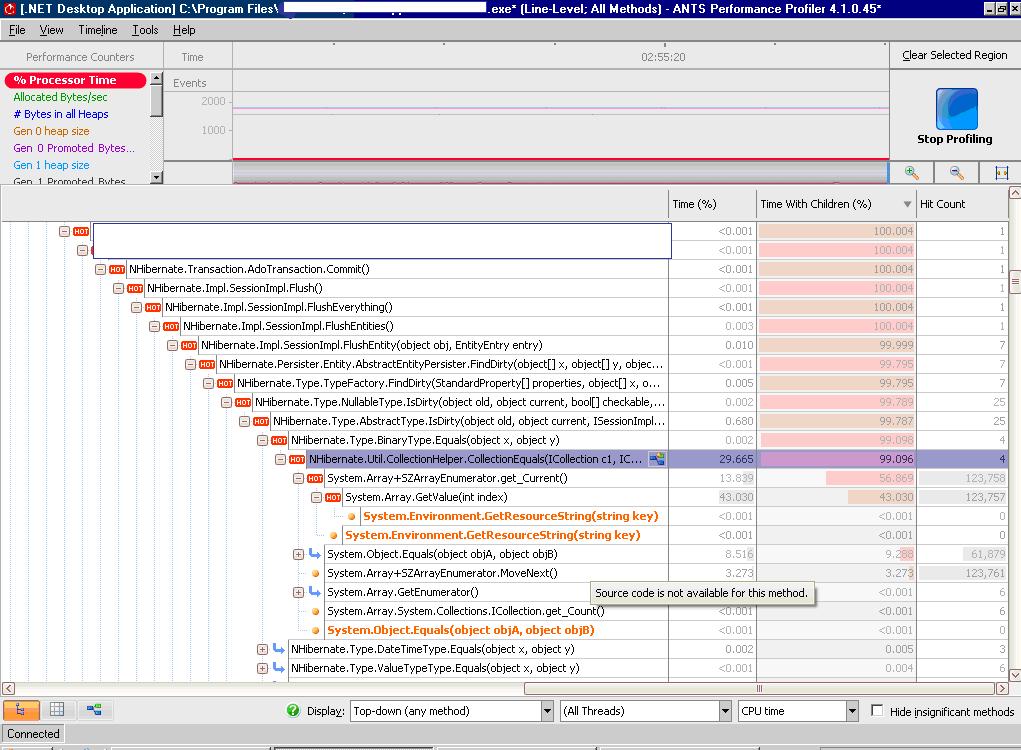
The main sustained CPU peak cause was discovered using ANTS profiler. Memory leaks, long GC cycles were discarded using the mentioned free tools.

ANTS profiler will let you set .NET performance counters and it will attach itself to the application being debugged. You cannot set breakpoints, afaik, but can go back in the profiler results and drag your cursor over a region to get a full called stack walk. It also goes beyond that and will indicate the % of time each method is taking on CPU and the % of time its children take on CPU usage.

Finally! A tool that will correlate performance counters the called stack for you and will indicate % of CPU time per method. This information you cannot gather by taking memory snapshots or called stack snapshots, unfortunately the free tools were only useful to discard memory leaks and GC related problems on this particular case. They narrowed down the places to look into.

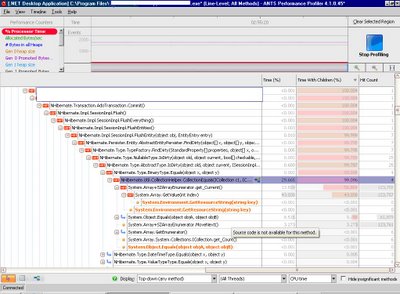
As you can see from the ANTS Profiler screen shot the application was indeed doing stuff, in this case comparing collections of bytes, byte per byte…Ouch!

We were able to identify the Collection comparison problem (byte[] arrays were being compared when the
NHibernate session was flushed and persisted even when they didn’t changed). We correlated this with a
fixed NHibernate bug:
http://jira.nhibernate.org/browse/NH-1246
and changed our mapping attributes to indicate there was no need to update the BinaryBlob fields. Our application either inserts the binary data or deletes its.

Note: you should be logged into http://jira.nhibernate.org/ before navigating to this bug report, registration is free.

Our NHibernate version and mapping strategy contained the buggy bits…

I hope this post hasn’t turned out too long, by upgrading NHibernate we solved the mystery of performance downgrade over time, the more the user worked with persistent binary data in the application the longer this loop comparing byte per byte on each collection took.

Upgrading NHibernate added to a performance challenge in another area, the application start up was taking longer. This will go on Part II as I should get some sleep.

Sweet dreams!

PS. VSTS 2008 has very promising capabilities for debugging high CPU usages, almost as good as ANTS Profiler, see this post

If you call your .NET application from a batch file…

If you deploy your .NET applications with a batch file, be aware that the way you call your .NET application might affect how it behaves.

The facts are as follows (for our application anyways):

when the application is called using the following line in the batch file:

start C:\Progra~1\ApplicationFolder\Application.exe

the application fails

if you call the application using the windows explorer in the batch file:

explorer C:\Program Files\ApplicationFolder\Application.exe

it works fine but it shows a security warnings that you’re downloading files and that publisher is unknown…Not good for the end user, not good.

If you call the application from a path that doesn’t have white spaces using the start command, it works fine:

start C:\ApplicationFolder\Application.exe

(This option would be good if we didn’t use Program Files for the deployment, but most people do)

and, finally, if you use the start command but take out the DOS path it works!

start ” ” “c:\Program Files\ApplicationFolder\Application.exe”

I checked the assemblies binding errors, the code access security for every assembly in the application, debugged the application, et-cetera without results.

Changing the old DOS path did the trick!!!

Why? I still have to get a hold on this script guy to ask him why :-p

Happy coding!

how to determine the assembly evidence at runtime

I ran into a problem the other day, one of the .NET applications we had deployed started crashing on some screens for no apparent reason. The application worked fine in the development environment and when called from the C drive in the test machine.
We tested for binding problems using the SDK tool fuslogvw.exe, but didn’t see any binding errors. The other SDK tool we tried was the .NET Framework configuration tool MScorcfg.msc, no luck. As the SDK doesn’t ship with the Framework 2.0 we had a trouble to do these tests on every single production machine…let alone that the Configuration tool does not show run-time evidence for a given assembly.
Maybe the enterprise policy had changed for the different zones and this .msi had been pushed without us knowing…
The MScorcfg.msc said otherwise…

This code and extra logs in our application did the trick on determining the evidence passed to the CLR:

private static void LogEvidence()
{

Zone myZone;
Url myURL;
Hash myHash;
Site mySite;

String strEvidence = “”;

log(” ===================== Assembly Evidence: ========================= “);

foreach (Object myEvidence in System.Reflection.Assembly.GetExecutingAssembly().Evidence)
{
strEvidence = myEvidence.GetType().ToString();

switch (myEvidence.GetType().ToString())
{
case “System.Security.Policy.Zone”:
myZone = (Zone)myEvidence;
strEvidence = strEvidence + “: ” + myZone.SecurityZone.ToString();
break;
case “System.Security.Policy.Url”:
myURL = (Url)myEvidence;
strEvidence = strEvidence + “: ” + myURL.Value;
break;
case “System.Security.Policy.Hash”:
myHash = (Hash)myEvidence;
strEvidence = strEvidence + “: ” + BitConverter.ToString(myHash.SHA1);
break;
case “System.Security.Policy.Site”:
mySite = (Site)myEvidence;
strEvidence = strEvidence + “: ” + mySite.Name;
break;
default:
break;
}

log(strEvidence);

}
log(” ===================== End of Assembly Evidence: ==================== “);

}