I love my job, I get to spread the good news on how to work efficiently with source code and solve very real-life problems.
I recently visited a development team in Nevada that was eager to learn more about Visual Studio debugging tools and the C# compiler Open Source project in GitHub, named ‘Roslyn’.
The highlight of the sessions was the ‘discovery’ of IntelliTrace and how they could use this feature in improving the communication between the development team in Nevada and the QA team at another location. A few hard to reproduce bugs had been filed recently, one of them being intermittent without a consistent set of steps to reproduce. This team was using process dumps and WinDbg to try and pinpoint the cause, but, even though process dumps have their reason of being, the size of the dump files made the quest to search for a root cause quite difficult.
This is until they tried IntelliTrace in their QA environments.
IntelliTrace is similar to a flight recorder. It records every event the airplane goes through from take off to landing. IntelliTrace had its debut in Visual Studio 2010 Ultimate and is now here to stay.
The IntelliTrace standalone collector is a free download that can be used on a Windows OS that doesn’t necessarily have Visual Studio installed. At the time of this blog post, it requires a .NET Framework 3.5 or higher installed on the OS where the traces will be collected. The collector generates files with .iTrace extension. Here’s an article on how to use it.
One of my favorite training videos on IntelliTrace is this one by one of the Product Managers, the video covers IntelliTrace in VS 2015, but all of it is still applicable on VS 2017.
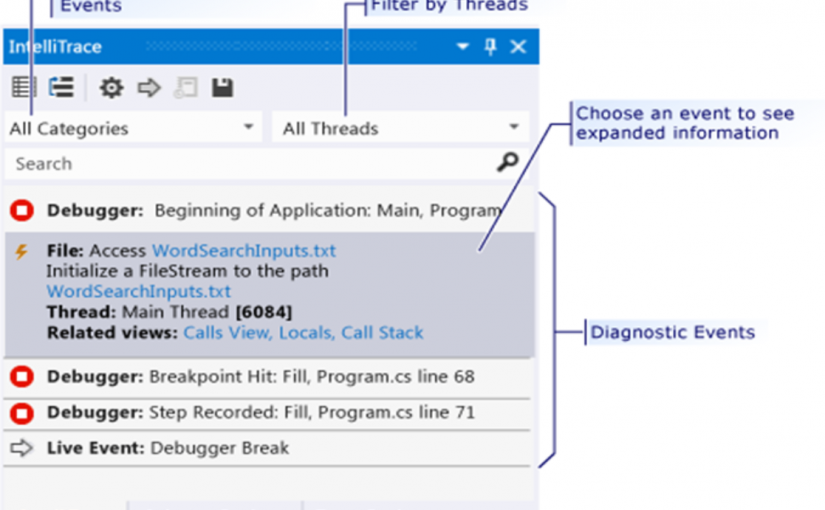
The .iTrace file collected can be opened with the VS IDE, see feature image at the top of this post with some of the events recorded as part of the collection session. When you drill down (click) on each recorded event, you have the ability to inspect the Locals, Autos, and have every single debugging windows available to you with the state of the application as it was at the time of the event recorded.
There is also a free hands-on-lab on IntelliTrace provided by the product group for the IntelliTrace newbie looking to test things out in a testing VM.
The ability to see historical events, step through the code as it was right before a crash condition, makes IntelliTrace a very valuable debugging and diagnostic tool.
Happy coding!