PowerShell Profiling

As part of my job I help developers take a closer look at the source code and analyze it under the “microscope”. Part of this analysis is profiling the performance of different components on a solution for CPU usage, Network usage, IO and Memory usage. Trying to pinpoint areas of the code that consume the resources and see if there can be optimizations. This is what is known as profiling an application or a solution.

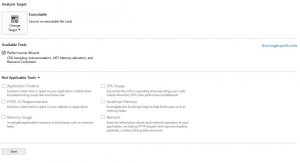
Visual Studio 2017, Community, Professional and Enterprise editions, all offer profiling and performance analysis tools. They cover a variety of languages,  and types of targets to be profiled. The image below shows the different profiling targets that can be analyzed with the Performance Profiler.

Performance Profiler in VS 2017

In the world of DevOps, part of the build automations are done using scripting languages, and one of them is PowerShell. After one of the training sessions on performance analysis and profiling with VS 2017, the question was posed:

How can we analyze the performance of PowerShell scripts to determine the areas of the code that consume the most CPU and take the most time to complete?

The main aid that the VS 2017 perf tools offer is the ability to show the source code that takes the most CPU utilization (identifying these sections of the code as “Hot Paths”) and the areas of the code that will place the most objects in the heap without being garbage collected by any of the three garbage collection cycles (memory leaks). VS 2017 profiling tools and diagnostic tools can also analyze multi-threaded applications or applications that use parallel tasks. But how about profiling PowerShell code? How can a similar profiling be done to PowerShell source code to look at CPU and Memory utilization?

Visual Studio 2017 does not offer a specific profiling wizard or GUI for PS to correlate the OS CPU performance counters and the Memory counters with the PowerShell script code.

That being said, you can still profile PowerShell code, it’s not as easy though.

Using PowerShell you can still access the CPU counters and Memory counters available in the operating system.

This can be done using the System.Diagnostic namespace or in versions of PS 3.0 to 6.0 you can use the PS cmdlets in the namespace Microsoft.PowerShell.Diagnostics

https://docs.microsoft.com/en-us/powershell/module/microsoft.powershell.diagnostics/?view=powershell-6

You can also use the Windows Management and Instrumentation cmdlets, but the recommended way for profiling a process on remote hosts is to use the WinRM and WSMan protocols (newer protocols) and their associated cmdlets.

These were the only references I’ve seen on the web regarding CPU and Memory analysis of OS processes using PowerShell:

https://stackoverflow.com/questions/25814233/powershell-memory-and-cpu-usage

https://stackoverflow.com/questions/24155726/how-to-get-cpu-usage-memory-consumed-by-particular-process-in-powershell-scrip?noredirect=1&lq=1

https://docs.microsoft.com/en-us/powershell/module/Microsoft.PowerShell.Management/Get-Process?view=powershell-6

https://docs.microsoft.com/en-us/powershell/module/microsoft.powershell.management/get-wmiobject?view=powershell-5.1&viewFallbackFrom=powershell-6


Now, for using the WMI protocol on a host, the WMI windows service needs to be up and running and listening on TCP/IP port 135. WMI is an older protocol built on top of DCOM, and some hosts have this windows service stopped as part of the host hardening.

WinRM is a service based on SOAP messages, it’s a newer protocol for remote management with default HTTP connections listening on TCP/IP ports 5985. If the connection uses transport layer security with digital certificates the default HTTPS port is 5986.

WMI, WinRM and WSMan only work on Windows Servers and Windows Client Operating Systems.

One needs to inject profiling like cmdlets directly into the PowerShell code to find the code hot spots that cause high CPU utilization.  This can work but then one needs to remember to either comment out or delete the direct instrumentation when the PowerShell code is run in the production environment.

If you have profiled your PowerShell automation scripts some other way, we’d love to hear your experience.


Happy coding DevOps!

Identifying performance bottlenecks on a .NET windows app using Windows Debugging Tools and ANTS Profiler. Part I: NHibernate byte[] types

This is a curious case that led me to discover and use a very valuable tool ANTS Profiler and read a few good blogs about .NET debugging and CLR internals. Read on to bookmark with me.

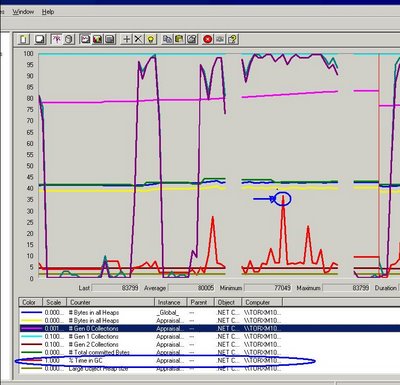
Near to Christmas we received a complain one of the windows applications was performing too slow after a few hours of usage. Performance monitor counters indicated the performance problem lied on high CPU peaks sustained for a long period of time.

.Net memory counters were somewhat fine, no increase on allocated bytes or overall memory consumption, no high IO reads, no high network usage…apparently the application was just doing its stuff, but for a long time, and each time longer…

First thing that came to our mind was an infinite loop, however the curious part on this case is that the CPU peaks took longer the longer the end user worked on the application and began to be noticeable after a couple of hours, not quite the definition of an infinite loop.

If only had we had a better CPU, had the performance downgrade been noticeable after more hours. This is something we had to be thankful for, bad CPU, less time to reproduce the problem. This was one of the typical production only problems too :-p

Long sustained CPU peaks, how we dug down on the cause:

First we grabbed the free debugging tools (insert the obvious reasons here, budget, management approval, etc): CLRProfiler, winDGB, SOS and ADPlus.

Two great blog posts about how to start with these tools can be found here (Speaking Of Which) and here (Maoni’s blog).

MSDN Magazine also has two good articles (Bugslayer column and this CLR Inside Out column) on the subject of windows debugging tools and how to use them in VS 2005.

Back to our own experience on the matter, CLRProfiler hung the machine beyond response and despite being able to sketch the object graph in memory, it was hard to correlate the time of the high CPU peaks with the information obtained from CLRProfiler.

This was not due to a problem with the tool itself, hanging was due to poor iron power and our over-consuming application and the inability to detect the main CPU usage cause was due to the fact that CLR profiler is only meant to identify and isolate problems related with garbage collection, excessive long lived objects or huge collections.

At first we thought the high CPU could be related with garbage collection due to long lived objects, see this post on Tess’s blog If broken it is, fix it you should.

We collected memory dumps with ADPlus during the high CPU peaks as per this lab blog post and analyzed the memory dumps using WinDBG.

At the end we decided to have more control on when the dumps were taken and use WinDBG while attaching it to the process. I should also mentioned ADPlus ended up generating dumps with errors when the system was really stressed.

Instructions to take dump via WinDBG :
1. Run the application.
2. Open up WinDBG. Click on File ?> Attach To Process ?> Select the process ?> Click on OK.
3. WinDBG attaches to the process and waits on the command line. Press ‘g’ and hit enter. ‘g’ is for letting the
application run.
4. Now whenever you want to take a dump, Hit Ctrl+Break in WinDBG. Now, type : .dump /ma C:\Dump1.dmp
This will take a dump.
5. Press ‘g’ and hit enter for the process to resume.

WinDBG can give valuable information about the CLR stack at the time the dump was collected (clrstack command), the types being scheduled for GC (!finalizequeue) and how many types marked for finalization belong to Gen 0, Gen 1 and Gen2.

Seeing your managed stack at a single point in time or having exact information about the memory allocation does not give information on the amount/% of CPU time each method takes though.

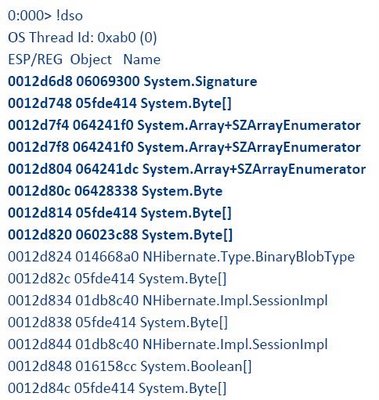
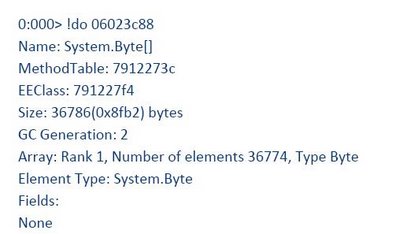
We tried taking dumps with WinDbg at the beginning of the CPU peak, in the middle and at the end but the results only offered a hint, too many Collections were allocated and lived to Gen 2. Some of this collections were byte arrays. It wasn’t apparent from analyzing the three managed stacks (from the three memory dumps) which method was consuming the longest time.

So far we had lots of collections surviving to Generation 2 and some of them were of type byte array. Garbage collection counters, however were within the “normal”.

If the application was just “busy” doing its stuff, where was this time spent? Data Binding? Event Brokerage? Database access latency and query performance had been already discarded with SQL Profiler btw.

The main sustained CPU peak cause was discovered using ANTS profiler. Memory leaks, long GC cycles were discarded using the mentioned free tools.

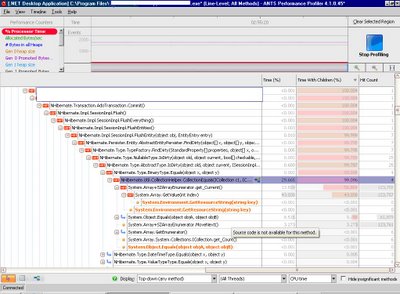
ANTS profiler will let you set .NET performance counters and it will attach itself to the application being debugged. You cannot set breakpoints, afaik, but can go back in the profiler results and drag your cursor over a region to get a full called stack walk. It also goes beyond that and will indicate the % of time each method is taking on CPU and the % of time its children take on CPU usage.

Finally! A tool that will correlate performance counters the called stack for you and will indicate % of CPU time per method. This information you cannot gather by taking memory snapshots or called stack snapshots, unfortunately the free tools were only useful to discard memory leaks and GC related problems on this particular case. They narrowed down the places to look into.

As you can see from the ANTS Profiler screen shot the application was indeed doing stuff, in this case comparing collections of bytes, byte per byte…Ouch!

We were able to identify the Collection comparison problem (byte[] arrays were being compared when the
NHibernate session was flushed and persisted even when they didn’t changed). We correlated this with a
fixed NHibernate bug:
http://jira.nhibernate.org/browse/NH-1246
and changed our mapping attributes to indicate there was no need to update the BinaryBlob fields. Our application either inserts the binary data or deletes its.

Note: you should be logged into http://jira.nhibernate.org/ before navigating to this bug report, registration is free.

Our NHibernate version and mapping strategy contained the buggy bits…

I hope this post hasn’t turned out too long, by upgrading NHibernate we solved the mystery of performance downgrade over time, the more the user worked with persistent binary data in the application the longer this loop comparing byte per byte on each collection took.

Upgrading NHibernate added to a performance challenge in another area, the application start up was taking longer. This will go on Part II as I should get some sleep.

Sweet dreams!

PS. VSTS 2008 has very promising capabilities for debugging high CPU usages, almost as good as ANTS Profiler, see this post